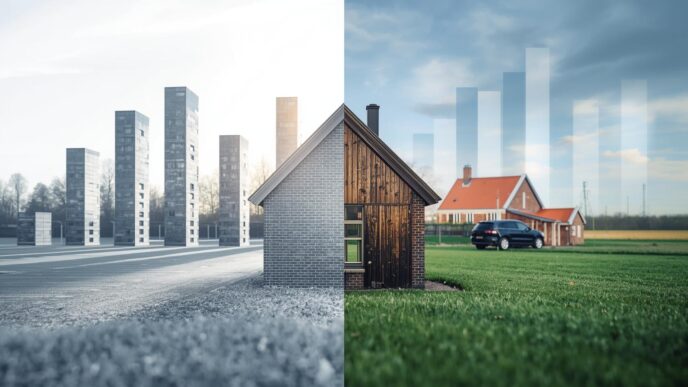
Nieuwbouwkavels (new building plots) in the Netherlands jumped 15.3% year-over-year in Q4 2025.
This is the fourth straight quarter of faster growth. Prices have doubled since 2015. Regional inequalities reach 3.5x.
Property-type spreads exceed 10 percentage points.
This structural repricing raises costs for anyone planning facility expansion, property development, or real estate investment in 2026.
Core Facts:
- Building plot prices rose 13.6% across the full year 2025 vs. 2024
- Q4 2025 saw 15.3% year-over-year increase, continuing quarterly acceleration since Q4 2023
- Regional price range: €384/m² (Groningen) to €1,412/m² (Utrecht)
- Property-type variation: tussenwoningen plots up 17.5%, vrijstaande woningen plots up only 7.3%
- Drenthe saw the highest growth at 23.1% despite the lowest absolute prices.
For expat entrepreneurs, this trend reshapes your cost assumptions for investment or development. Data comes from CBS and Kadaster. Numbers show more than headline inflation: regional disparities at 3.5x, property-type price spreads over 10 percentage points, and a decade-long doubling of land costs make historical comparisons unreliable.
This analysis breaks down what’s happening, where costs rise, and what to review in your real estate business planning.
What Changed in Building Plot Prices
Building plot prices increased 13.6% across the full year 2025 compared to 2024. The quarterly pattern matters more than the annual average.
Prices have increased faster every quarter since Q4 2023. Costs build up each quarter.
Quarterly progression (year-over-year change):
- Q4 2023: +3.7%
- Q1 2024: +4.7%
- Q2 2024: +5.1%
- Q3 2024: +6.7%
- Q4 2024: +8.7%
- Q1 2025: +11.0%
- Q2 2025: +12.8%
- Q3 2025: +15.3%
- Q4 2025: +15.3%
This is not a market correction. Anyone budgeting for real estate must now factor in structural cost increases for the next 12–24 months.
Key Point: Using 2023 or early 2024 land prices for 2026 projects puts your assumptions off by double digits.
Why Historical Comparisons No Longer Work
The recent acceleration sits atop a decade-long price explosion. Building plots have doubled since 2015.
In 2015, the average nieuwbouwkavel cost €425 per m². By 2024, it reached €767 per m². That’s a 95% increase in ten years.
This is a problem for entrepreneurs: historical comparisons no longer work for financial modeling.
If you’re using market data from five years ago to estimate land acquisition costs, you’re underestimating by roughly 50%. If you’re using data from ten years ago, you’re off by nearly 100%.
This affects:
- Small developers’ modeling project feasibility
- Businesses planning warehouse, workshop, or office facility purchases
- ZZP professionals considering property investment as a wealth-building strategy
- Owner-managed businesses evaluating rural or peri-urban location expansions
Key Point: Don’t use old land cost benchmarks. Always update to the current regional data for 2026 decisions.
How Property Type Affects Land Costs
The average 13.6% annual increase masks significant variation across property types.
Plots for terraced houses (tussenwoningen) increased by 17.5% in 2025. Plots for hoekwoningen (corner houses) rose 16.1%. Plots for vrijstaande woningen (detached houses) increased only 7.3%. Plots for twee-onder-een-kap (semi-detached) rose 6.9%.
That’s a 10+ percentage point spread between the highest and lowest categories.
If you’re a small developer or business owner, property type choice is now a key cost factor for mixed-use, construction, or investment.
Why does this happen?
Tussenwoningen use less land, so they’re sought-after in dense city zones where scarcity raises prices. Vrijstaande woningen need more land and are located in areas with lower land pressure.
For business planning, this means:
- If you’re acquiring land in urban or peri-urban zones, expect the steepest cost increases.
- If you’re planning mixed-use or multi-unit development, terraced or corner configurations face higher baseline land costs
If you’re targeting rural or low-density locations, detached property plots offer relative cost stability.
Key Point: Property type matters. Run multiple cost scenarios before choosing a development approach.
Regional Cost Disparities and Tactical Location Decisions
The Netherlands doesn’t have a single building plot market. Multiple regional markets exhibit significant cost disparities.
Provincial breakdown for average price per m²:
- Utrecht: €1,412
- Zuid-Holland: €1,373
- Noord-Holland: €1,136
- Noord-Brabant: €854
- Gelderland: €829
- Drenthe: €432
- Friesland: €404
- Groningen: €384
That’s a 3.5x price differential between Utrecht and Groningen.
For expat entrepreneurs and small business owners, this changes the range of locations where facility development, expansion, or real estate investment remains economically viable.
If you’re running a business that doesn’t require proximity to Amsterdam, Rotterdam, or Utrecht, relocating operations or facilities to northern or eastern provinces reduces land acquisition costs by 60% to 70%.
There’s a counterintuitive twist in the growth rates.
Drenthe experienced the highest price increase in 2025 at 23.1%, despite having some of the lowest absolute prices. Zuid-Holland followed at 18.3%, Gelderland at 16.1%, and Friesland at 15.3%.
Zeeland had the lowest increase at 1.4%.
This pattern shows that affordable regions are closing the gap. If you were counting on northern or eastern provinces to remain cost-stable arbitrage opportunities, the window is narrowing.
Business planning implications:
- If you’re targeting low-cost regions for expansion, expect accelerating price growth even in historically affordable areas.
- If you’re modeling multi-year facility development, factor in regional price convergence
If you’re evaluating relocation, compare current prices and projected growth rates over your planning horizon.
Key Point: Regional cost arbitrage remains real, but the gap is closing faster in low-cost provinces than in expensive ones. Lock in land acquisition decisions earlier if you’re targeting northern or eastern locations.
Municipal Land Price Policy Is Shifting
Municipalities control much of the supply of building plots. Their pricing strategies impact the market.s.
In 2024, 57% of municipalities increased land prices by an average of 3.3%, with Zuid-Nederland leading at 5.0%. For 2025, municipalities planned an average increase of 3.4%, with Oost-Nederland expecting 4.3%.
There’s a competing trend.
More municipalities now keep cost recovery below €5,000 per housing unit. 60% did this in 2023 compared to 30% in 2020. This suggests policy tension between revenue maximization and development feasibility.
What this means for small developers and businesses acquiring municipal land:
Municipal land pricing isn’t purely market-driven. The pricing reflects local policy priorities: housing supply, affordability, and revenue generation.
If you’re negotiating land acquisition from a municipality, understand whether they emphasize cost recovery or development stimulation. This distinction affects your negotiating position and pricing expectations.
Some municipalities offer more preferential pricing to support business development or housing supply. Others maximize revenue to fund infrastructure or public services.
Key Point: Municipal land pricing is determined by policy. Research the grondprijsbeleid before negotiating.
Agricultural Land Prices Add Upstream Pressure
Building plot prices depend on the upstream agricultural land prices.
Agrarische grondprijzen (agricultural land prices) reached €95,400 per hectare in 2025, up 11.8% from 2024 and more than 60% higher than in 2016. The Q4 2025 price jumped 12.7% in a single quarter to €104,700 per hectare.
This raises the price of the building plot, as converting raw land becomes more expensive.
If you want rural or peri-urban land, you now face a higher starting cost.
Why this matters:
If you’re evaluating greenfield development (acquiring agricultural land and converting the land to commercial or mixed-use purposes), you’re starting from a higher baseline cost.
Agricultural land at €95,400 per hectare translates to roughly €9.54 per m². That’s before bouwrijp maken (making the land construction-ready), which includes infrastructure, utilities, permits, and site preparation.
In Zuid-Nederland, prices for undeveloped land in expansion locations have risen from approximately €50 per m² to €75-100 per m². That’s the cost before bouwrijp status. Total land acquisition costs include additional infrastructure preparation expenses on top of these already elevated baseline prices.
Key Point: If your business model involves greenfield development or the conversion of raw land, factor in both increases in agricultural land prices and bouwrijp preparation costs. The total cost structure has changed considerably since 2020.
How This Affects Your Business Planning
If real estate plays a role in your business (as an operational asset, expansion requirement, or investment strategy), these price dynamics affect your financial planning in specific ways.
For small developers and construction-related businesses:
- Land acquisition now represents a larger share of total project costs.
- Project feasibility models built on 2023 or 2024 land prices underestimate current costs by 10% to 15%
- Regional and property-type selection now carries material financial consequences.
- Margin compression is likely unless you adjust pricing or shift to lower-cost regions.
For businesses planning facility expansion:
- Land costs for warehouse, workshop, or office facilities have increased faster than general inflation.
- Delaying land acquisition exposes you to continued price escalation, especially in northern and eastern provinces.
- Relocation to lower-cost provinces delivers considerable savings, but the cost gap is narrowing.
- Municipal land policies vary—research local grondprijsbeleid before negotiating.
For ZZP professionals and small business owners considering property investment:
- Investing in building plots as a wealth-building strategy involves higher entry costs.
- Historical return assumptions based on pre-2020 land prices no longer apply
- Regional diversification matters more in western provinces, which are significantly more expensive but also more liquid.
- Property type selection affects both acquisition cost and future resale or development potential.
What to Do Now
If you’re evaluating real estate decisions in 2026, review the following:
1. Update your land cost assumptions
If your financial model uses land prices from 2023 or earlier, revise them. Use current regional data from CBS, Kadaster, or local municipal grondprijsbeleid reports.
2. Run regional cost scenarios
Compare land costs across provinces where your business operates. The 3.5x price differential between Utrecht and Groningen is large enough to justify relocation analysis.
3. Evaluate property type trade-offs
If you’re planning development, model costs for multiple property configurations. The 10+ percentage point spread between tussenwoningen and vrijstaande woningen affects project feasibility.
4. Research municipal land pricing policies
If you’re negotiating with a municipality, understand their grondprijsbeleid priorities. Some municipalities prioritize development stimulation over revenue maximization.
5. Factor in continued price escalation
The quarterly acceleration pattern suggests prices will continue rising through 2026. If you’re planning land acquisition, delaying increases your cost exposure.
6. Review greenfield development assumptions
If your business model involves converting raw land, factor in both increases in agricultural land prices and bouwrijp preparation costs. The total cost structure has changed significantly.
7. Monitor regional convergence trends
The northern and eastern provinces are experiencing faster price growth than the western provinces. If you’re targeting low-cost regions for cost arbitrage, that window is narrowing.
Frequently Asked Questions
Why are building plot prices rising so fast in the Netherlands?
Multiple factors drive the increases: limited land supply in high-demand regions, rising agricultural land prices creating upstream pressure, municipal policy variations, and sustained demand for housing and commercial development. The quarterly acceleration since Q4 2023 suggests structural supply constraints, not temporary market swings.
Which Dutch provinces have the cheapest building plots?
Groningen (€384/m²), Friesland (€404/m²), and Drenthe (€432/m²) have the lowest absolute prices. Watch for rapid price increases in these regions. Drenthe saw the highest growth rate at 23.1% in 2025, despite the low absolute prices.
Should I wait for building plot prices to come down?
The data shows accelerating quarterly growth since Q4 2023, with no signs of reversal. Prices have doubled since 2015. If you’re planning land acquisition, delaying exposes you to continued price escalation. Evaluate whether your business model is viable at present and projected prices.
How do municipal land prices differ from private market prices?
Municipal land pricing reflects local policy priorities (housing supply, affordability, revenue generation) rather than pure market forces. Research the specific municipality’s grondprijsbeleid. Some prioritize development stimulation and offer more preferential pricing. Others maximize revenue to fund infrastructure.
What is bouwrijp maken, and how does it affect total land costs?
Bouwrijp maken means preparing land for construction by providing infrastructure, utilities, permits, and site preparation. Agricultural land at €9.54/m² becomes €75-100/m² in Zuid-Nederland expansion locations before construction. Factor these preparation costs into greenfield development budgets.
Which property types face the highest land cost increases?
Tussenwoningen (terraced house) plots increased 17.5% in 2025, followed by hoekwoningen (corner houses) at 16.1%. Vrijstaande woningen (detached houses) rose only 7.3%. The 10+ percentage point spread makes property type selection a material financial planning variable.
Are low-cost regions like Drenthe good opportunities for business expansion?
Drenthe offers land at €432/m² compared to €1,412/m² in Utrecht. The cost reduction hits 70%. Prices there rose 23.1% in 2025, the highest in the Netherlands. Low-cost regions are closing the gap faster than expensive ones. Lock in decisions earlier if targeting these locations.
How should I update my financial models for real estate projects?
Replace any land cost data from before 2024. Use current regional data from CBS and Kadaster. Run scenarios for multiple provinces and property types. Factor in quarterly price acceleration (15.3% year-over-year in Q4 2025). Add contingency for continued escalation through 2026.
Key Takeaways
- Building plot prices rose 15.3% year-over-year in Q4 2025, with quarterly acceleration every period since Q4 2023. This is structural repricing, not temporary market adjustment.
- Regional cost disparities reach 3.5x (€384/m² in Groningen vs. €1,412/m² in Utrecht). Location decisions now carry material financial consequences for expansion and development.
- Property-type selection affects costs by 10+ percentage points. Tussenwoningen plots rose 17.5%, while vrijstaande woningen plots increased only 7.3%.
- Low-cost provinces show faster price growth than expensive regions. Drenthe saw 23.1% increases despite the lowest absolute prices. Cost arbitrage windows are narrowing.
- Historical land cost data is unreliable. Prices have doubled since 2015. Update financial models with current regional data from CBS and Kadaster.
- Municipal land pricing reflects policy priorities rather than pure market forces. Research grondprijsbeleid before negotiating with local authorities.
- Delaying land acquisition exposes you to continued price escalation. If real estate plays a role in your business planning, evaluate timing decisions now rather than waiting for corrections.