Dutch property values rose 41% nationally between 2021 and 2025, with the median WOZ value reaching €3,320 per square meter. Amsterdam still leads at €7,111/m², but growth was only 24.8%. Secondary cities like Lelystad (64.8%) and Den Helder (61.6%) surged faster.
This regional rebalancing creates cost advantages for entrepreneurs operating outside the Randstad.
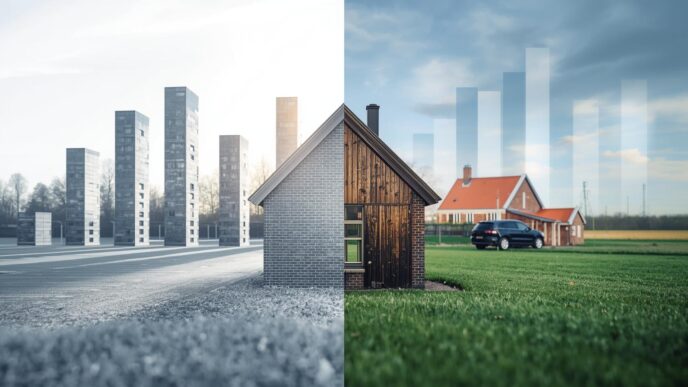
WOZ values directly affect your taxes, lease rates, salary demands, and total operating costs.
Core Facts:
- National median WOZ value: €3,320 per square meter (41% growth 2021-2025)
- Amsterdam premium: €7,111/m² (114% above national median, but slowest growth at 24.8%)
- Fastest-growing markets: Lelystad (64.8%), Den Helder (61.6%), Eemsdelta (55.9%)
- Tier 3 cities (Groningen, Zwolle, Nijmegen) offer talent pools with property costs 50% lower than in Amsterdam.
- WOZ values determine your OZB tax, box 3 wealth tax, and indirectly affect commercial lease rates and employee salary demands
CBS released 2025 WOZ data. The numbers tell a story most expat entrepreneurs aren’t watching.
The national median WOZ value per square meter reached €3,320. This is the official municipal property assessment that determines your local taxes, influences commercial lease rates, and shapes employee salary demands.
What matters for your business: Amsterdam commands €7,111 per square meter, but its growth rate was only 24.8% between 2021 and 2025. Lelystad surged 64.8%, and Den Helder increased 61.6%.
The Dutch property market is rebalancing. If you run a micro or small business, this shift creates exposure and opportunity.
How Do WOZ Values Affect Your Business Costs?
WOZ values aren’t tax assessments. They’re proxies for your total operating environment.
The mechanism:
High WOZ areas mean employees need higher salaries to afford housing. If you’re hiring in Amsterdam at €7,111/m², your talent expects compensation that reflects that reality. The same role in Groningen at €3,170/m² carries different cost expectations.
When you provide housing allowances for international hires, costs scale directly with local WOZ values. Amsterdam apartments cost 114% more per square meter than the national median. Structural multiplier.
Commercial lease rates reflect underlying property values. Landlords’ prices are based on market conditions. When WOZ values climb 41% nationally over four years, that pressure flows into verhuurder pricing models.
If you own business property, WOZ determines your onroerende zaakbelasting obligations to the gemeente and affects box 3 wealth tax calculations for residential properties you own.
Key Point: WOZ values create a cost multiplier across your entire operation. Higher WOZ areas mean higher salaries, higher lease rates, and higher tax obligations. The data maps the geographic concentration of your fixed costs.
What Does Regional Growth Tell You About Market Forces?
The 41% national growth between 2021 and 2025 significantly outpaces inflation over the same period (approximately 15-20% cumulative).
This is real appreciation, not nominal price drift.
The growth pattern reveals something useful:
The five municipalities with growth below 25% are all affluent Randstad locations already at premium valuations: Heemstede (20.5%), Bloemendaal (21.5%), Ouder-Amstel (23.8%), Laren (24.5%), Amsterdam (24.8%).
The municipalities showing 50%+ growth represent previously undervalued markets experiencing catch-up appreciation: Lelystad (64.8%), Den Helder (61.6%), Eemsdelta (55.9%), Midden-Groningen (54.0%), Rheden (54.0%).
This is an inverse relationship between absolute value and growth rate. Markets that were already expensive grew slowly. Markets that were affordable grew fast.
For founders: The window for accessing low costs with high growth in secondary cities is narrowing. Those markets moved from undervalued to fairly valued. The catch-up phase is complete.
Bottom Line: Already-expensive markets grew slowly. Affordable markets grew fast. The gap narrowed significantly between 2021 and 2025.
What Are the Geographic Cost Tiers in the Netherlands?
Dutch property markets operate in concentric rings around the Randstad core.
Tier 1 (Premium Randstad): €4,500+/m²
Amsterdam €7,111, Laren €5,697, Bloemendaal €5,336, Wassenaar €5,173
Tier 2 (Secondary Randstad): €3,500-5,500/m²
Utrecht €5,318, The Hague €3,891, Rotterdam €3,636
Tier 3 (Provincial Capitals): €2,500-3,500/m²
Zwolle €3,408, Groningen €3,170, Maastricht €2,899
Tier 4 (Peripheral/Challenged Areas): Below €2,500/m²
Emmen €1,995, Heerlen €1,881, Kerkrade €1,750, Pekela €1,603
If you’re evaluating a business location or a relocation, these tiers provide a framework for projecting cost structures.
Operating in Tier 1 means absorbing property-related costs 114% higher than the national median. That premium touches salaries, leases, customer spending power, and municipal service quality.
Operating in Tier 4 means accessing ultra-low property costs. But those values show underlying economic issues: declining populations, limited employment diversity, and insufficient consumer markets.
Strategic Perspective: Tier 3 cities offer the best positioning for micro and small businesses, thanks to their location flexibility. You get talent access without Randstad premiums and economic vitality without Tier 4 decline risks.
Why Are Northern and Eastern Netherlands Growing Faster?
Groningen, Zwolle, Nijmegen, Arnhem, and Maastricht demonstrate strong appreciation while maintaining values well below those of Randstad.
Three drivers:
Remote work has permanently altered Dutch settlement preferences. Over 5 million people in the Netherlands worked from home at least sometimes in 2023. That’s 52% of the entire labor force, the highest proportion in any EU country.
Knowledge workers now live in Groningen while maintaining Amsterdam-level salaries. This creates purchasing power that drives local property values without requiring a strong local job market.
For entrepreneurs, talent pools are geographically distributed. You establish operations in Tier 3 cities without sacrificing access to skilled workers.
Infrastructure investment shows up in the data. Lelystad’s 64.8% growth shows the projected economic impact of Lelystad Airport expansion and improved rail connections to Amsterdam (30 minutes via direct train). Den Helder’s 61.6% growth is driven by offshore wind industry development and port investments.
WOZ data captures forward-looking infrastructure expectations. Municipalities with growth rates exceeding 50% signal where the Dutch government and private capital are concentrating development investments.
The unemployment rate in East Netherlands was only 3.3% in 2023, with net labor-force participation at a historic high of 73.8%. The largest sectors in North Netherlands include care and well-being (22%), retail (11%), and industry (11%).
The Reality: These regions deliver economic activity, not low prices. Tight labor markets (3.3% unemployment), high participation rates (73.8%), and sector diversity make these locations viable.
Why Municipality-Level Analysis Isn’t Enough
Most founders analyze at the gemeente level. This misses variance.
Within the city of Groningen, WOZ values per square meter range from €1,853 (Ten Post e.o.) to €3,918 (Centrum). A 112% differential within one municipality.
Within Amsterdam, values range from an average of €7,111 to €10,000-€12,000 in prime central areas like the Grachtengordel and Jordaan.
Strategic neighborhood selection impacts your fixed costs, even within a single city.
If you hire employees, a housing allowance sufficient for Ten Post e.o. won’t work for Centrum. If you lease commercial space, the wijk determines whether you pay Tier 2 or Tier 3 rates within the same gemeente.
Action Required: Analyze at the neighborhood level, not the municipal level. Within-city variance exceeds between-city variance.
What Do Ultra-Low WOZ Values Signal?
Limburg municipalities cluster at the bottom of value rankings with modest growth rates:
Kerkrade €1,750 (35% growth)
Simpelveld €1,847 (37% growth)
Heerlen €1,881 (39% growth)
Brunssum €1,933 (40% growth)
Landgraaf €2,060 (43% growth)
These aren’t opportunities. These are warnings.
Ultra-low WOZ values reflect fundamental economic conditions: declining populations, limited employment diversity, and infrastructure shortfalls.
For entrepreneurs, these municipalities signal insufficient consumer markets or talent pools to support new ventures. South Limburg’s proximity to Germany and Belgium hasn’t translated into stronger property values.
Warning Signal: A North-South economic divide is taking shape in the Netherlands. Economic vitality is concentrated in the Northern Netherlands and the Randstad. Southern border regions encounter persistent structural challenges. Low property values alone won’t solve these.
How Do WOZ Values Determine Your Tax Obligations?
When you own business or residential property as an entrepreneur, WOZ values determine multiple tax obligations.
For residential properties, WOZ determines the eigenwoning forfait calculations and affects box 3 wealth tax.
An entrepreneur owning a 100 m² apartment in Amsterdam (€711,100 WOZ) faces different tax treatment than one owning the same square meterage in Pekela (€160,300 WOZ).
The €550,800 difference in assessed value creates substantial divergence in annual tax obligations under Dutch wealth taxation. Net entrepreneurial returns vary based on geographic choice.
For business properties: WOZ determines onroerende zaakbelasting obligations to the gemeente.
Verify the specific gemeente’s OZB tariff (available on municipal websites) and multiply by your property’s WOZ value to project annual costs. High-value municipalities generate substantially more tax revenue per square meter than low-value ones, even with identical OZB rates.
The Cycle: High-value municipalities generate more tax revenue per square meter, fund better infrastructure and services, attract businesses and residents, and sustain high valuations. Low-value municipalities face the opposite.
What Actions Should You Take With This Data?
WOZ data enables strategic management across multiple business dimensions.
When establishing or relocating operations:
Calculate your total cost exposure. When hiring employees, Amsterdam’s 114% property premium correlates with proportionally higher salary demands. If you’re a dienstverlener targeting local consumers, €7,111/m² neighborhoods have different spending capacity than €2,000/m² areas.
When negotiating commercial leases:
Refer to CBS data when a verhuurder proposes a rent disproportionate to local WOZ values. You have objective market data.
When recruiting internationally:
Use WOZ values per square meter to calculate realistic housing budgets for employees throughout various Dutch regions. Ensure compensation packages correspond to local market conditions rather than assumptions.
When evaluating regional opportunities:
Monitor annual WOZ developments (CBS releases this data yearly) as a leading indicator of regional economic conditions. Municipalities with sustained above-average growth rates benefit from infrastructure investment, demographic trends, or industry development, creating business opportunities beyond real estate.
For micro and small businesses with location flexibility:
Look at positioning in Tier 3 cities: Groningen, Zwolle, Nijmegen, Maastricht, or Arnhem. These markets offer university talent pools, reasonable living costs for employees, and appreciation momentum, all of which indicate economic vitality.
These locations avoid the premium Randstad cost structure and the economic stagnation visible in the lowest-value municipalities.
Decision Framework: Use WOZ data to calculate total cost exposure before establishing operations, negotiate commercial leases with objective market data, and set realistic compensation packages aligned with local housing costs.
What Does This Data Tell You About Market Timing?
The four-year timeframe (2021-2025) captures the full post-pandemic property surge.
The 41% national increase outpaces inflation, indicating real appreciation. Growth has concentrated in previously affordable areas.
Timing question: Do municipalities with 50-60% growth still offer cost advantages, or have they reached price equilibrium with their fundamentals?
The answer varies by location, but the pattern suggests the steepest phase of appreciation in secondary cities is behind us.
If you were considering relocating to capture lower costs with expansion momentum, the window has narrowed. Those markets moved from bargains to fairly valued.
This doesn’t mean they’re bad choices. The competitive edge shifted from “undervalued with high growth” to “fairly valued with stable fundamentals.”
Market Timing Insight: The explosive appreciation phase in secondary cities (2021-2025) is complete. Tier 3 cities still offer considerable savings compared to Randstad operations, but the competitive advantage has shifted from “undervalued with high growth” to “fairly valued with stable fundamentals.”
What Is the Core Strategic Value of WOZ Data?
WOZ data maps where Dutch economic vitality is concentrated.
WOZ data shows which municipalities fund infrastructure and services. It shows where talent is choosing to live and which regions are capturing investment.
For expat entrepreneurs running micro and small businesses in the Netherlands, this data lets you make location decisions based on structural cost analysis instead of assumptions.
You can quantify the premium you’re paying for Randstad operations. You can identify which secondary cities offer genuine economic development versus stagnation. You can calculate employee compensation packages that correspond with actual local housing markets.
The system doesn’t care about your intentions or preferences. It measures costs, taxes, and market realities.
Structure your business location strategy around objective data. That’s how you maintain control when property markets shift.
Frequently Asked Questions
What is a WOZ value, and why does it matter for my business?
WOZ (Waardering Onroerende Zaken) is the official municipal property assessment in the Netherlands. WOZ determines your onroerende zaakbelasting (property tax), affects box 3 wealth tax calculations, and serves as a proxy for your total operating environment. High WOZ areas correlate with higher salary demands, lease rates, and business costs.
How much more expensive is it to operate in Amsterdam versus other Dutch cities?
Amsterdam’s WOZ value of €7,111 per square meter is 114% higher than the national median of €3,320. This premium affects salary expectations, housing allowances, commercial lease rates, and property taxes. Tier 3 cities like Groningen (€3,170/m²) offer approximately 55% lower property costs while continuing talent access and economic vitality.
Which Dutch cities offer the best cost-to-opportunity ratio for small businesses?
Tier 3 cities (Groningen, Zwolle, Nijmegen, Maastricht, Arnhem) offer the best balance. They provide university talent pools, reasonable operating costs, and economic development without Randstad premiums or Tier 4 decline risks. WOZ values range from €2,500-€3,500/m², roughly 25-50% below Amsterdam, while labor markets remain strong.
Are secondary Dutch cities still good opportunities after 50-60% growth?
The catch-up appreciation phase (2021-2025) is complete. Cities like Lelystad (64.8% growth) and Den Helder (61.6% growth) moved from undervalued to fairly valued. They still offer cost advantages over Randstad, but the explosive-growth window has closed. The advantage now is “stable fundamentals” rather than “high expansion momentum.”
How does remote work affect Dutch property values and business location decisions?
52% of Dutch workers now work at least some of the time, the highest rate in the EU. This lets knowledge workers live in lower-cost regions while maintaining Amsterdam-level salaries. For entrepreneurs, talent pools are geographically distributed. You access skilled workers in Tier 3 cities without sacrificing quality.
Why are some Dutch municipalities so cheap? Should I consider them for my business?
Ultra-low WOZ values (below €2,000/m²) demonstrate underlying economic issues: declining populations, limited employment diversity, and infrastructure shortfalls. South Limburg municipalities like Kerkrade (€1,750/m²) and Pekela (€1,603/m²) offer low costs but lack sufficient consumer markets or talent pools to support new ventures. Low property values alone don’t create a business opportunity.
How often should I review WOZ data for business planning?
CBS releases WOZ data annually. Monitor it yearly as a leading indicator of regional economic conditions. Municipalities showing sustained above-average growth rates likely benefit from infrastructure investment, demographic trends, or industry development that creates business opportunities beyond real estate.
Do WOZ values affect commercial lease negotiations?
Yes, indirectly. Commercial lease rates reflect underlying property values. When WOZ values climb 41% nationally over four years, pressure flows into landlord pricing models. Use CBS WOZ data as objective market evidence when a landlord proposes rent disproportionate to local valuations.
Key Takeaways
- Dutch property values rose 41% nationally (2021-2025), significantly exceeding inflation. This is real appreciation, not nominal drift.
- Amsterdam holds the highest absolute WOZ value (€7,111/m²) but showed the slowest growth (24.8%). Secondary cities like Lelystad (64.8%) and Den Helder (61.6%) grew fastest, signaling regional rebalancing.
- An inverse relationship exists between absolute value and growth rate. Already-expensive markets grew slowly. Previously affordable markets grew fast. The catch-up phase is complete.
- Tier 3 cities (Groningen, Zwolle, Nijmegen, Maastricht, Arnhem) offer optimal positioning for small businesses: access to talent, economic vitality, and 50% lower costs than in Amsterdam.
- WOZ values create a cost multiplier across your operation. They determine property taxes, influence lease rates, drive salary demands, and affect wealth taxation. Geographic choice directly affects net returns.
- Analyze at the neighborhood level, not just the municipality level. Within-city WOZ variance can exceed 100% (e.g., in Groningen, it ranges from €1,853 to €3,918/m² within one municipality).
- Ultra-low WOZ values signal economic problems, not opportunities. South Limburg municipalities cluster below €2,000/m² with declining populations and limited employment diversity.